

There has been a lot of uncertainty surrounding the real estate market over the last few years. We have seen unprecedented highs and lows in sales and market value, lived through unforeseen world events and multiple changes in governing regulations. It’s been a lot! So, there’s no wonder so many are still feeling apprehensive about what the market has in store. Nevertheless, if we pause for a moment to zoom out and examine the real estate market in Collingwood, Blue Mountain and the rest of SGB beyond this particular timeframe, the situation appears significantly more optimistic.
That means it’s time to look at the stats! We’ve created a five-year Comparative Market Analysis (CMA) report to provide an overview of the significant changes in the market over the past few years, a comparison to previous years, and a glimpse into what can be expected in the future.
If reading is not your preferred method, don’t worry as we have an alternative. Watch the video below to see Chris Keleher guide you through the data or keep reading at your own pace.
This video has been condensed for easy viewing. You can watch the extended version here if you want to hear Chris speak in more detail.
Get your copy of the Southern Georgian Bay Comparative Report for 2022 here or book a no-obligation call with Chris to discuss anything real estate!
This blog post feature focuses on two specific pages of the report that present valuable insights into shifts in the market. We’ll be examining key measurable listing statistics from 2018 to 2022, which reveal important trends that can only be fully appreciated when viewed collectively across all the years.
Are we returning to normality after three years of chaos?
The second half of 2022 followed a rollercoaster market filled with uncertainty, eight interest rate hikes in the span of one year and a warped buying and selling perspective based on two years of unprecedented sales. Nobody in the real estate industry could confidently tell you what was up, what was down and what would follow. But now it’s time to put our hindsight lenses on and look at the story within the data!
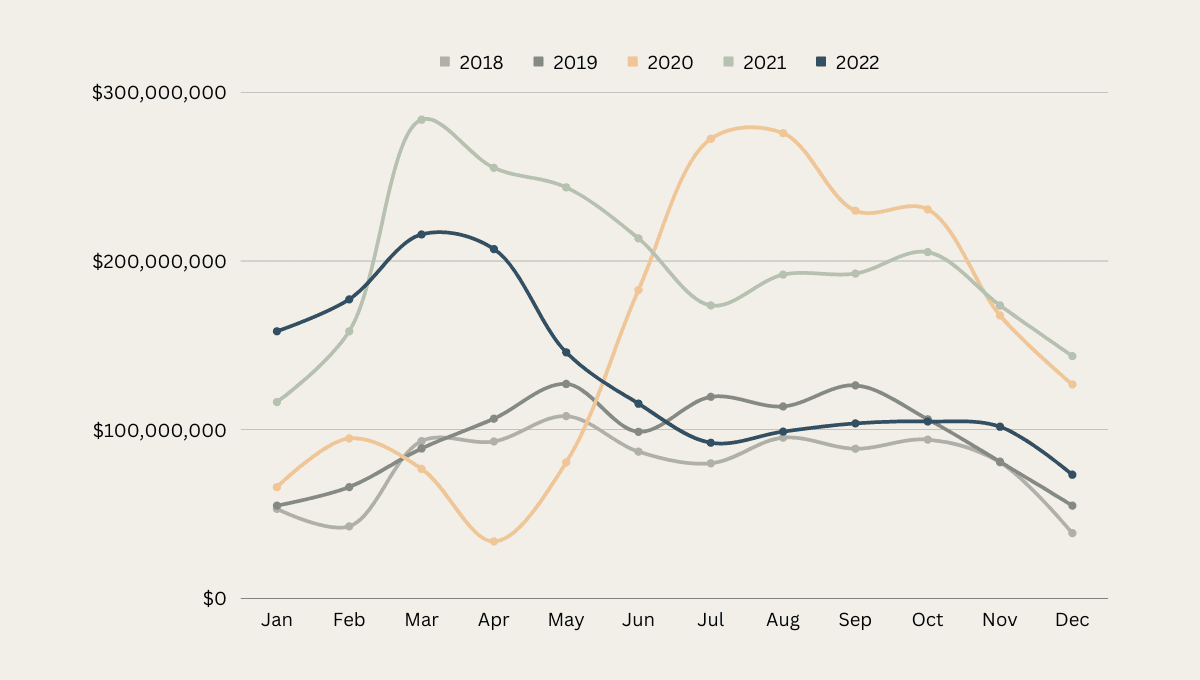
The dollar volume sales in 2018 and 2019 showed an upward trend in spring, with occasional dips in summer (when kids come out of school), another slight spike in the fall, and ending in a decline. These were two very good real estate years! Things changed in 2020, when the pandemic resulted in a huge drop in sales, followed by a repeat pattern as restrictions were lifted and reinstated.
The following year (2021) sees incredibly high dollar sales, a tail-off in summer and smaller spikes which start to show a more regular pattern in data. What comes next is the most amazing news; quarter one of 2022 saw a $100 million increase in sales, which started to level off similarly to 2018 and 2019.
Over the final six months of last year (2022), we thought the sky was falling. The feeling from the majority was “the market’s down – it’s bottomed out.” – the worst of the worst. But we were comparing the height of the market for dollar volume sales back in the first quarter of 2022. Despite the panic, the market actually remained strong.

The section highlighted in the image above shows that for the last six months of 2022, we were back on track for a normal dollar volume sales market as it pertains to the two years prior to the pandemic hitting. Which is fantastic news for us.
Dollar sales don’t tell us everything…
The next part of our data story is illustrated by unit sales. What’s interesting is that our unit sales correlate with changes in the average sale price. This shows another perspective of how our market has reached a balanced state by the end of 2022.
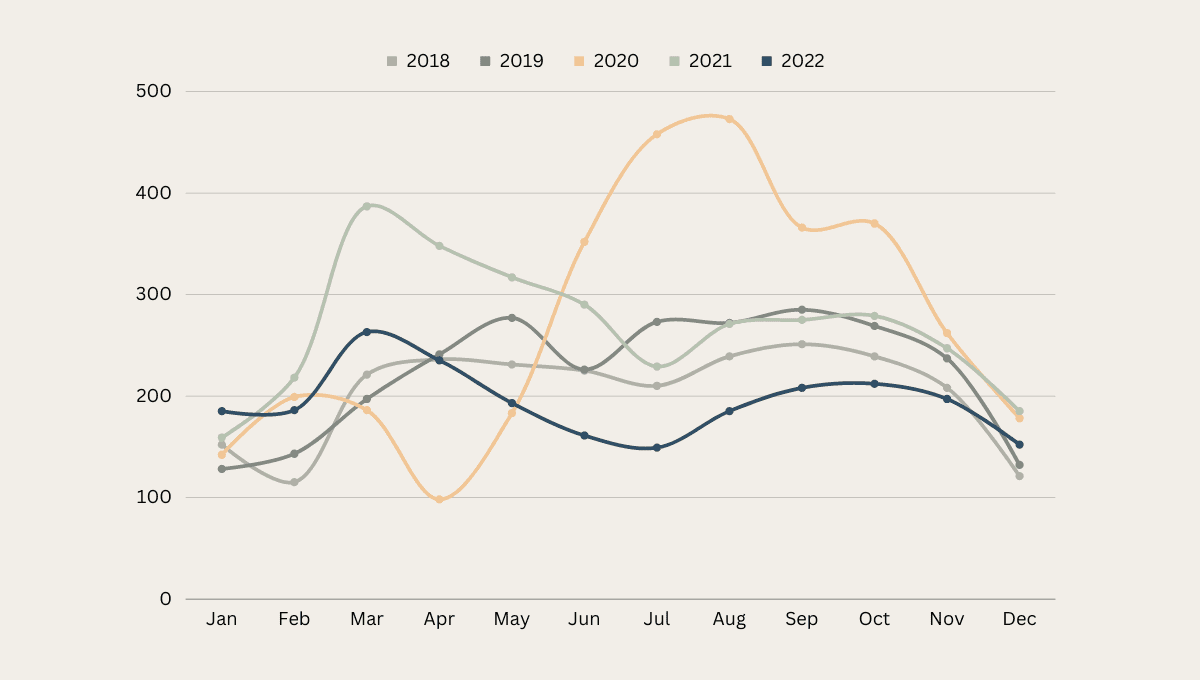
What we see here is a clear separation between the years before the pandemic (2018 & 2019) and the anomaly year of 2020, and a gradual introduction of familiar data patterns within the real estate market – what we call a “balanced market”.
The initial spike in 2022 remained high for dollar volume sales and average sale price, but when we look at the number of units sold, it actually fell in line with that “balanced market” pattern we’ve seen in prior years. The summer unit sales then fell a bit lower compared to what would be a “normal” year; with the last few months reaching that balance once again. In theory, this sets us in good standing for 2023.
Highs, lows and interest rate panic.
When the numbers get released month over month for January and February, we will likely see them as optically terrible sales months year over year. This is because January and February and March of last year were incredibly high in terms of unit and dollar volume sales and average price sales. So, the important thing to recognize is the optics look bad only in comparison to the unicorn months of sales.
The reality is we’re back on track. These five-year graphs tell us that we are back to a normal, balanced way of selling real estate. With an expected increase in the average sale price and currently a higher interest rate than the last couple of years.
That said, if we look back at the interest rates of 2018; they were between 3.5 and 4% (see the National Bank’s current rate here). Which means the jump is comparatively lower versus what it was a year ago when you could get a mortgage for about 1.1% (maybe you could get it fixed for closer to 2%). We’re getting back into a state of balance with some acceptance around the market’s position, and we’re seeing some familiar patterns.
What does this all mean for market value?
So, the sales are starting to come into balance but there’s no doubt that we’ve experienced a big shift in the market. This becomes clear when we look at the sales statistics within each price range, side by side, across these five years.

In 2018, 2019 and 2020, most of the sales in our market were happening in the $300K- $500K range; with a swing of almost 100 each year. We saw that drop considerably in the last couple of years based on the rising prices – a decrease from 861 to 136 sales over the five years. That’s an 84% average sales decrease in one range!
The highest number of sales now sits within $500K to $800K with 610 sales in 2022 – an increase of 31% in the number of sales in this range. This pattern of increases continues through each price range, showing a complete shift in the overall market “value”.
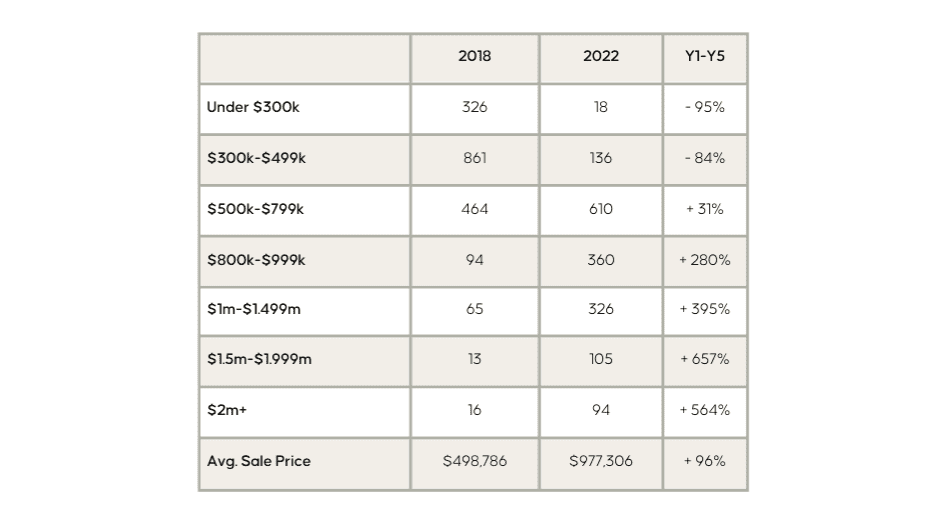
The decrease in average pricing overall in 2022 compared to 2021 has created a blind spot in the overall data. This blind spot stops us from seeing that we have actually seen the average price rise significantly over the last five years, regardless of the slight drop seen in 2022.
The range of $500K – $1.5 million holds the bulk of sales in 2022. Whereas five years ago the bulk of sales sat comfortably under $500K. The average sales price shifts from $498,786 to $977,306.
Get your copy of the Southern Georgian Bay Comparative Report for 2022 here or book a no-obligation call with Chris to discuss anything real estate!
This data is based on the entire region of Southern Georgian Bay. Remember, we trade in two counties and six municipalities here, so they’re all a little bit different. But overall we saw the average sales price essentially double last year.
These numbers show a very strong market with a growing market demand still in place across South Georgian Bay.
There’s a new perspective of the market moving into 2023.
In summary, we want to remind you of this incredible perspective of the market coming into balance with previous years in 2022.
This is what really tells the story. The stats are telling us that by the end of last year, we saw the dollar volume sales fall right in line with 2018 and 2019. A promising outlook for Southern Georgian Bay coming into 2023.
Cut through the buzz and book a no-obligation call with Chris Keleher to gain a deeper insight into the changing market and get answers to any burning real estate questions!
What is a Comparative Market Analysis (CMA)?
Real estate is one of the most significant investments that people make in their lifetime. As a potential buyer or seller, it is essential to understand the current state of the market before making any decisions. This is where a Comparative Market Analysis (CMA) comes in handy.
A CMA is a comprehensive report that helps real estate professionals and their clients understand the current market conditions by analyzing the recent sales of similar properties in the same area. It provides valuable insights into the local real estate market, such as the average selling price, days on the market, and the supply and demand of properties.